The latest scientific findings: The IPCC special report on global warming of +1.5°C
On 8 October 2018, the Intergovernmental Panel on Climate Change (IPCC) presented its ‘Special Report on the Impacts of Global Warming of 1.5°C’ to the world. These two panels are based on key messages from this 1,100+ page report prepared by 91 authors from 40 countries, who considered 6,000 publications and 42,000 comments from scientists and governments.
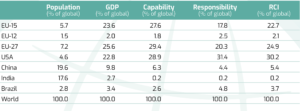
FAQ1.2: How close are we to 1.5°C?
Human-induced warming reached about 1°C above pre-industrial levels in 2017.
Due to our greenhouse gas emissions, the global temperatures currently lie at around 1°C above the pre-industrial levels. Global greenhouse gas emissions totalled ±36 billion tonnes of Co2 in 2016. If emissions continue at this rate, temperatures will rise by a further 0.5°C to 1.5°C by 2040 (± 10 years). The national emission reduction plans that countries submitted prior to the Climate Summit in Paris mean that the sum of CO2 emissions from 2011–2030 is projected to reach 750 billion tonnes of CO2, leading to a high probability (over 66%) of overheating by 2.9°C–3.4°C.
To prevent overheating above 1.5°C, global emissions must peak well before 2030 and be halved by 2030. This is possible, but requires immediate and drastic changes in our economies and behaviour.
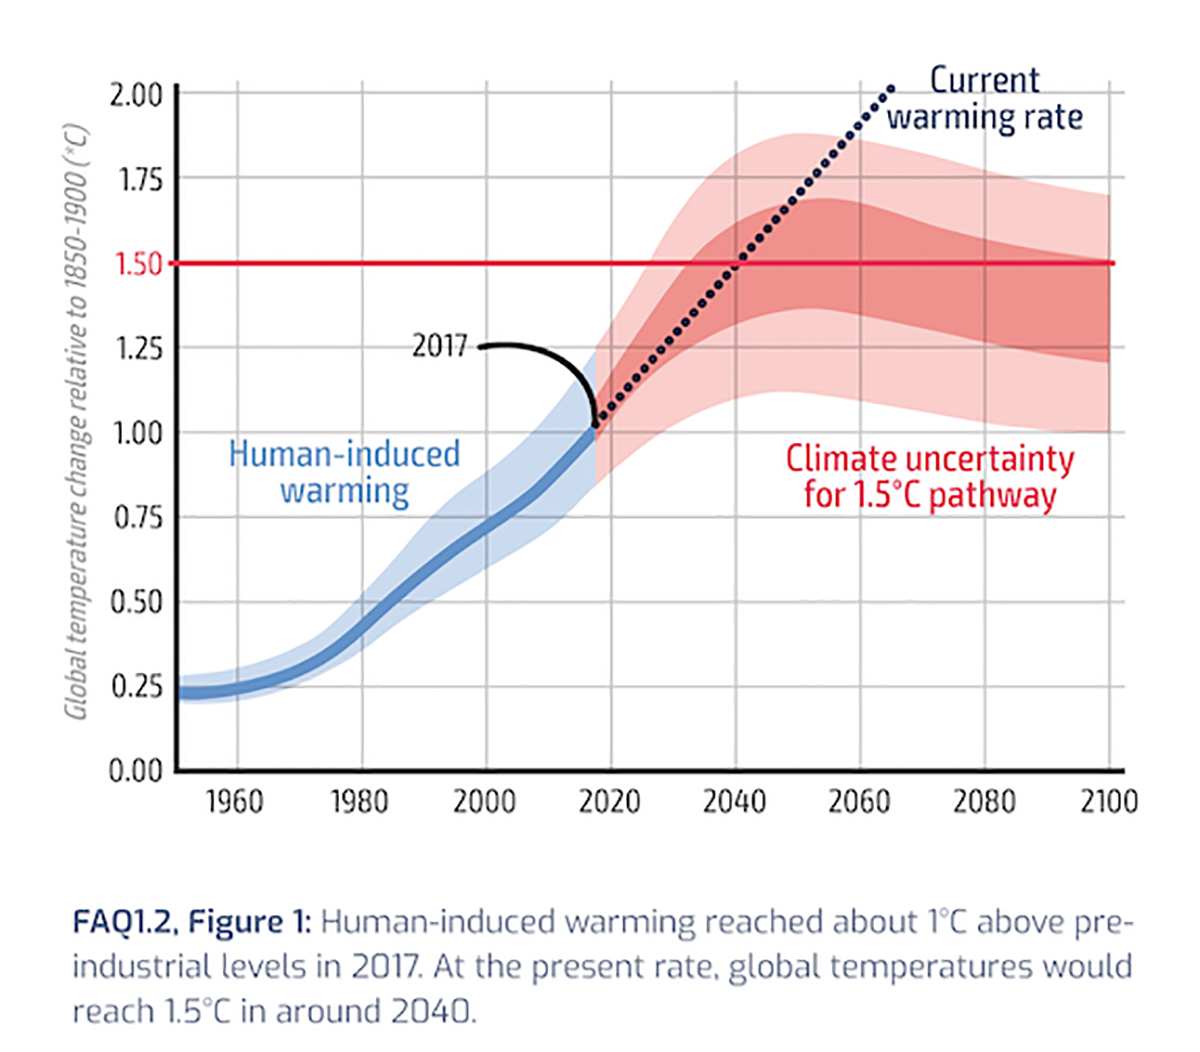
Regional warming from 2006 to 2015 compared to the pre-industrial level
Average annual warming
Warming is unevenly distributed around the globe: even today (average for 2006–2015), the north polar region is more than 1.5°C warmer than in the pre-industrial period (average for 1850–1900). At +1.5°C, the Arctic Ocean will be ice-free in summer once per century; at +2°C, already once per decade. This prompts chain reactions that exacerbate the situation: complete or partial melting of the polar cap at the North Pole will mean there wouldn’t be any (or at least less) white ice surfaces reflecting the sun’s energy, so the dark water would warm up instead. With warming of +2°C, the permafrost soils of the Nordic tundras, which are estimated to store twice as much carbon as the atmosphere, will thaw over a further two million square kilometres and release the powerful greenhouse gas methane into the atmosphere – this cannot be reversed.
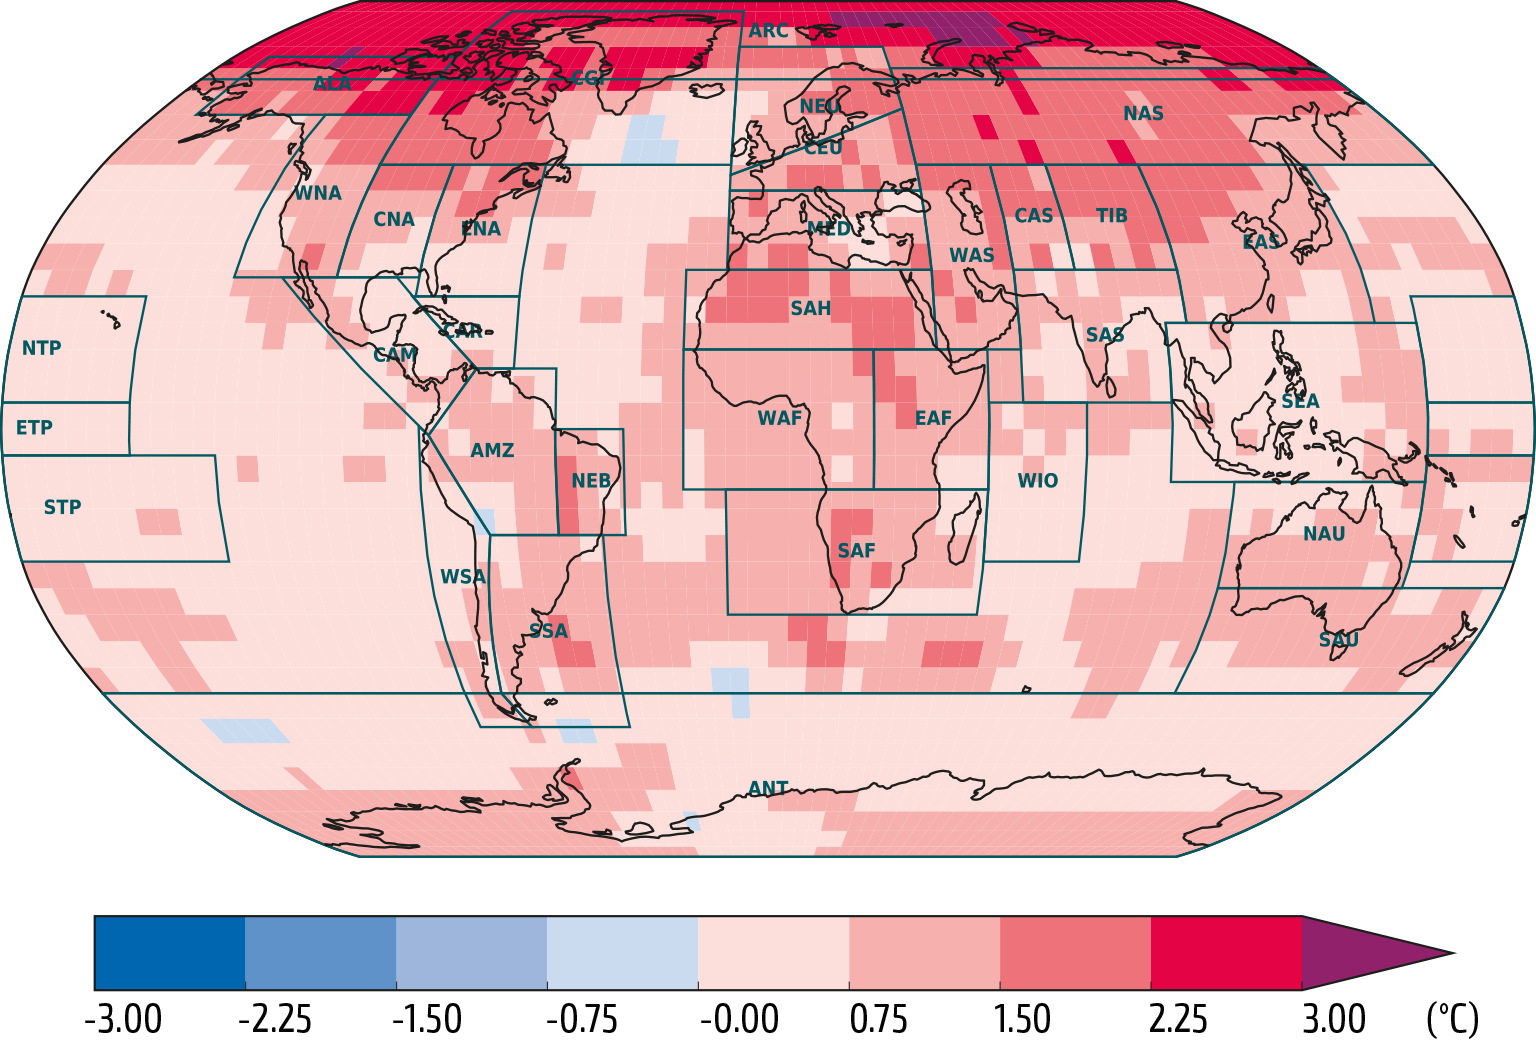
RISKS FOR CERTAIN NATURAL, MANAGED AND HUMAN SYSTEMS
The graphs depict the degree of risk to various natural and human systems depending on the amount of warming (+0.87°C on average for 2006–2015), 1°C, 1.5°C and 2°C. The first column shows, for example, that coral reefs are already suffering severe widespread damage, some of which is already irreversible.
Three serious risks are explained in greater detail on the following panel.
Cyclones and heavy rainfall
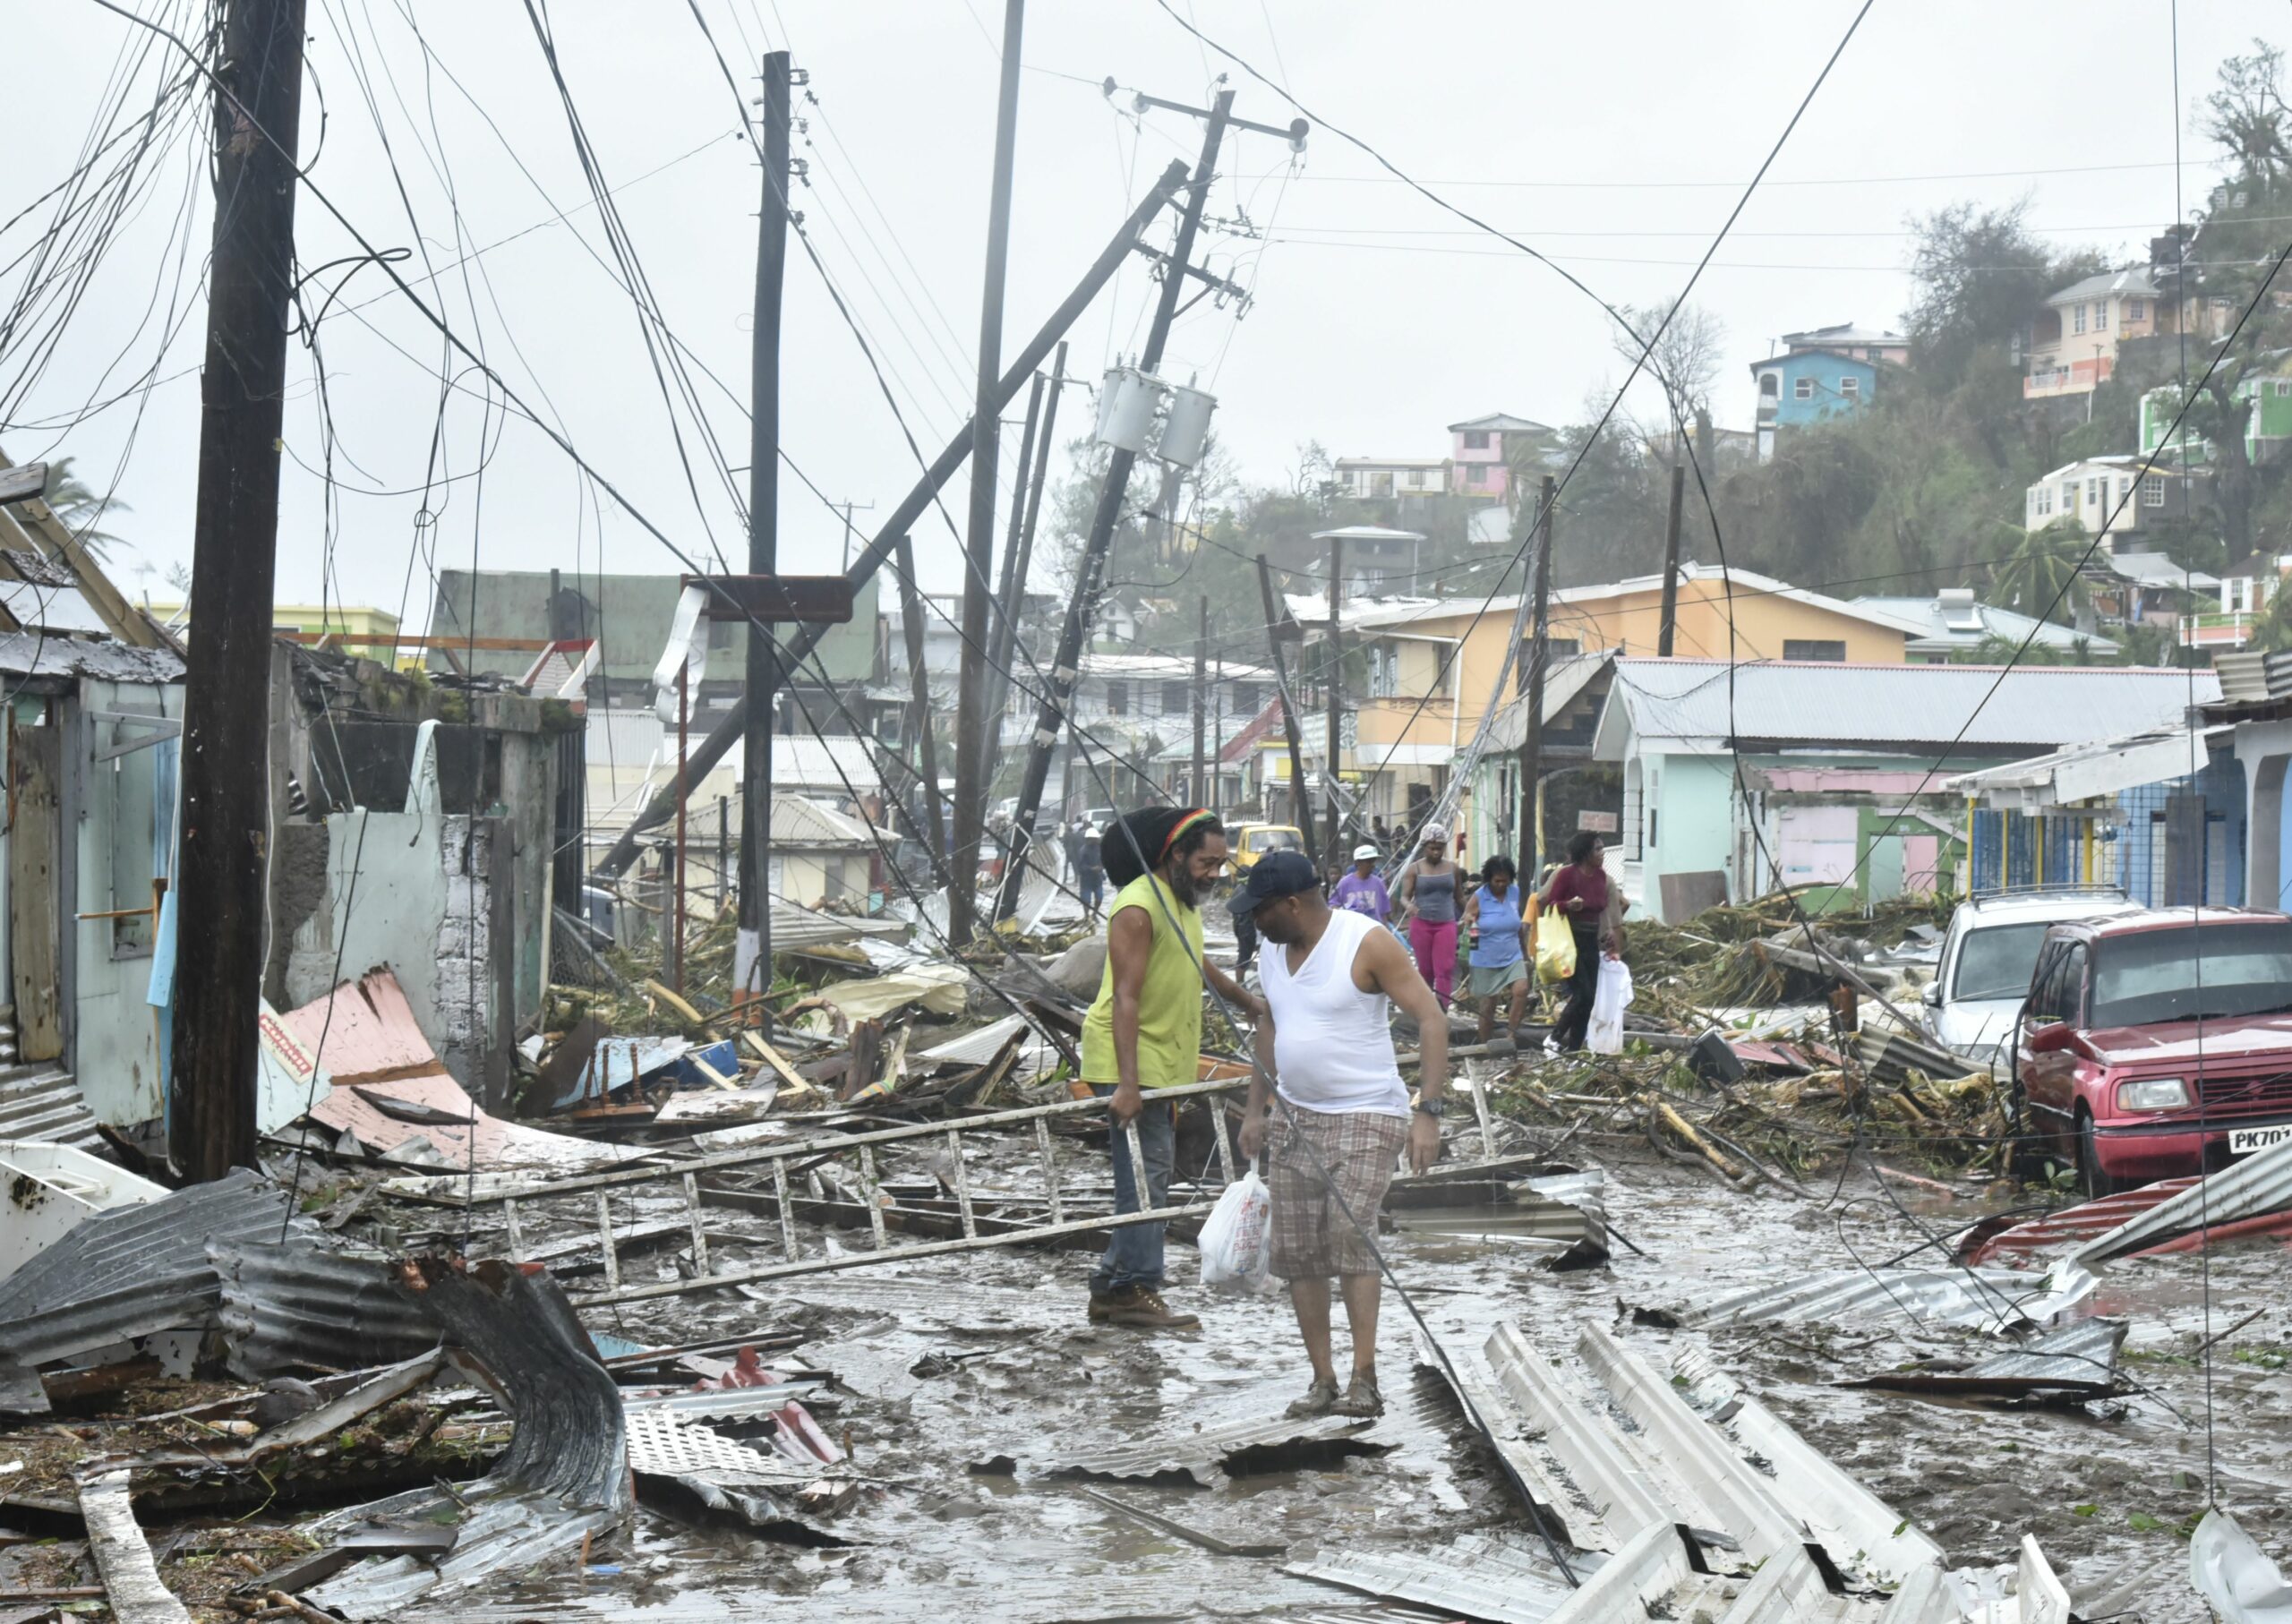
A street in Roseau / Dominica the morning after Hurricane Maria, September 2017
Due to the lack of historical data, studies on the total number of storms with increasing warming do not yield any clear trends. However, most studies on very severe cyclones indicate that they are becoming increasingly frequent.The risk of heavy rain is one third lower at +1.5°C than at +2°C.
Excerpt from the speech by the Prime Minister of Dominica, Roosevelt Skerrit, delivered on 16 November 2017 at the 23rd Climate Conference held in Bonn/Germany:
“Today, Dominica stands on the front line […] of the war on climate change. At 5pm on 17th September out of the mid-Atlantic Maria emerged as a Category 1 hurricane with wind speeds of just over 120 kph. Within 24 hours this monster storm had moved from a category 1 to a category 5 hurricane with wind speeds in excess of 270 kph. Our citizens barely had time to prepare before the ferocious winds and incessant rain began assaulting our nature island. […] When dawn broke, the scenes of utter devastation across this once lush green island, were heartbreaking. In some areas where houses once stood, there lay mounds of dirt and debris, others had their roofs blown off; landslides scarred the landscape, trees were uprooted or laid bare and flood waters raged. All utilities were non-functional. Assessments conducted by the World Bank Group and other international agencies indicate that 90% of buildings have either been damaged or destroyed, over 224% of GDP was wiped out. […] This, Ladies and Gentlemen, is the reality of climate change.”
DROUGHTS, FOREST FIRES, HARVEST LOSSES
Droughts are already increasingly evident in the Mediterranean region incl. Southern Europe, North and West Africa and the Middle East. They will continue to increase in frequency with further warming. Aridity and droughts will increase sharply at +2°C compared to +1.5°C, especially around the Mediterranean.
In West Africa, further warming will lead to shortages in harvests – for example of sorghum – and thus in turn to food insecurity. With increasing warming, the risk of forest and bush fires will continue to grow worldwide – especially in drier regions.
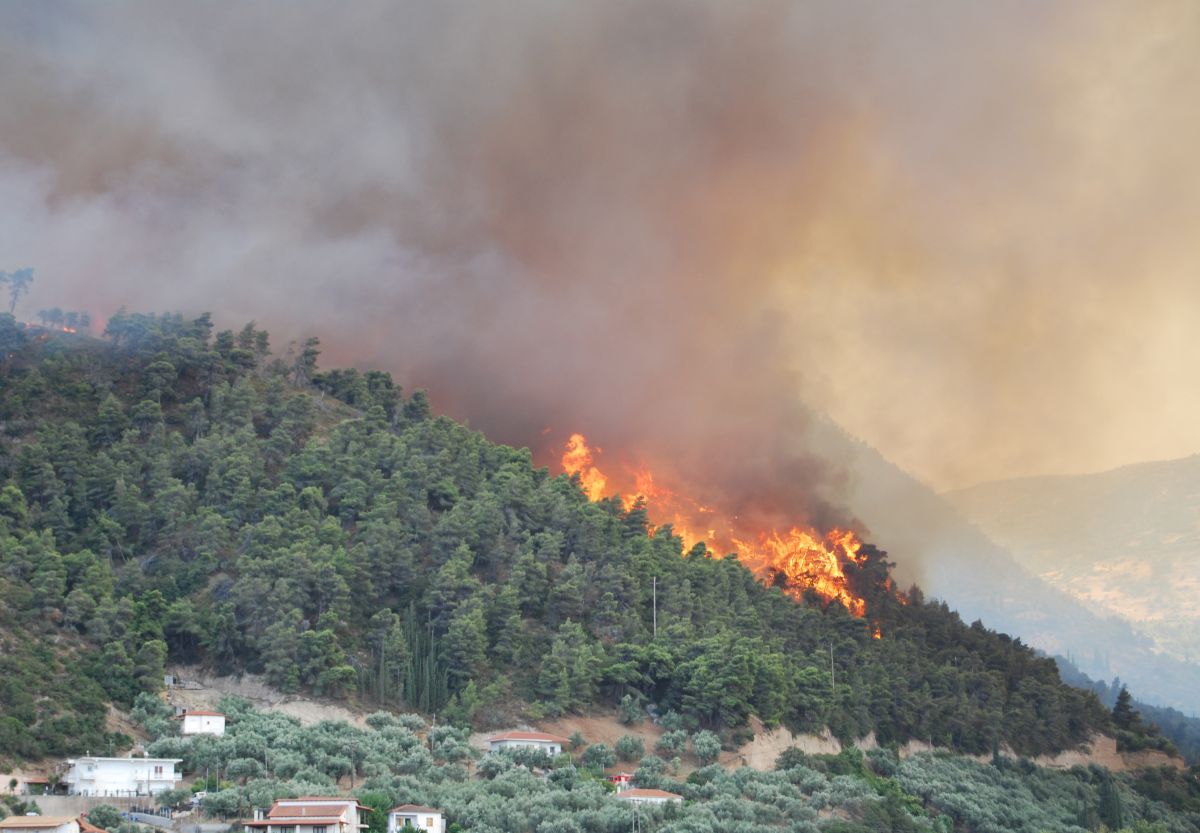
A forest fire near the Greek city of Patras in the Peloponnese, 18.07.2007.
Sinking Islands
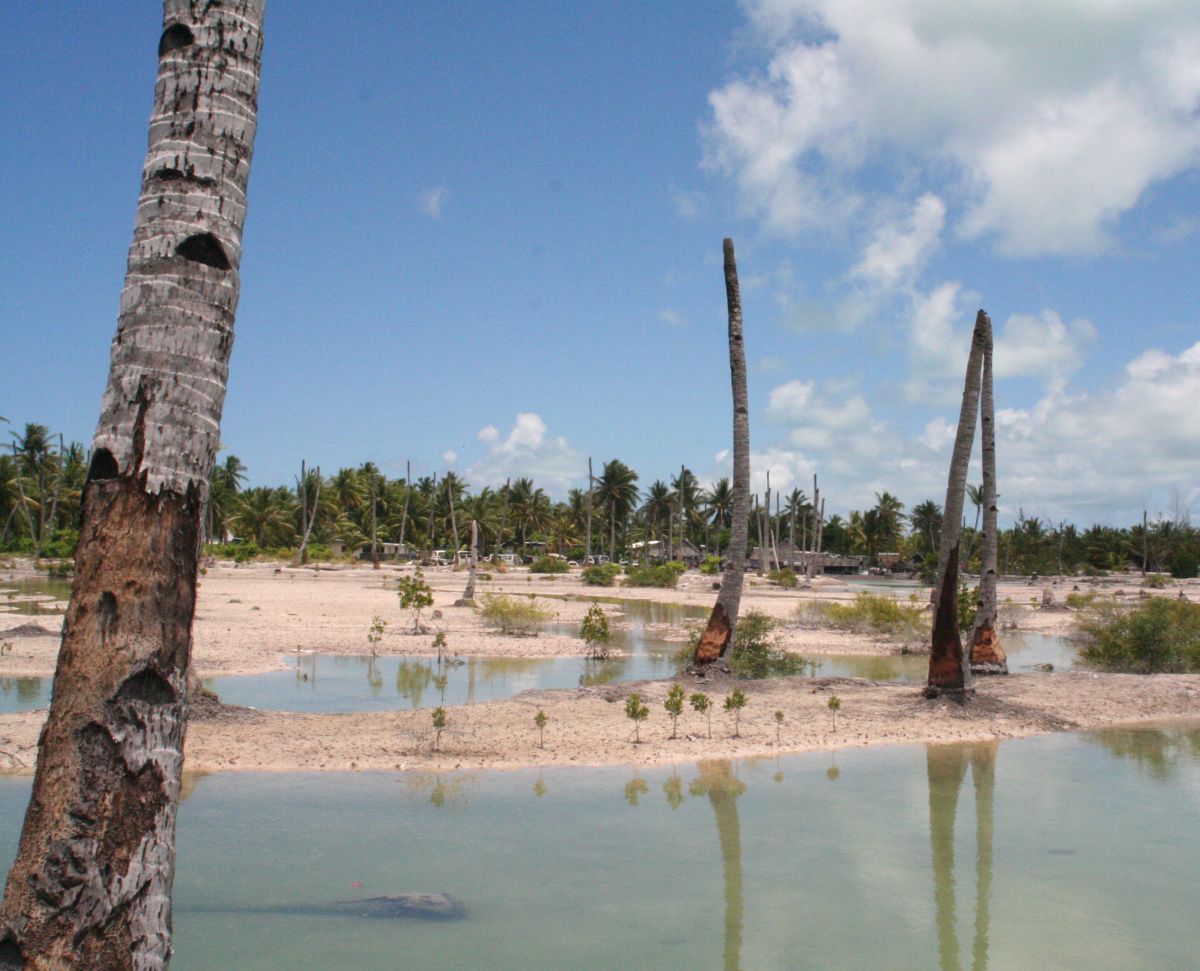
Rising sea levels and salinisation of the groundwater on Kiribati.
The fact that the effects of climate change mutually reinforce one another can among others be seen on the small Pacific islands:
The sea level has risen by ±8 cm so far and continues to rise. With warming of +2°C, the sea level will even be 10 cm higher in 2100 than it would with warming of +1.5°C. This will not only lead to flooding, but also to salinisation of the groundwater. The coral reefs will die out almost completely at +2°C – at +1.5°C, “only” 80% will die and offer scant protection against powerful waves. Acidification of the world’s oceans will increase and reduce marine communities such as algae, fish, etc. so that the catch rates will decrease twice as much at +2°C than at +1.5°C. All these factors add up and not only reduce the number of habitable islands, but also the usable land and food resources for millions of inhabitants of low-lying islands, deltas and coastal areas.
SUSTAINABLE DEVELOPMENT, POVERTY ERADICATION AND REDUCING INEQUALITIES
The Intergovernmental Panel on Climate Change devotes an entire chapter to the link between the UN’s Sustainable Development Goals (SDGs), poverty eradication and reducing inequalities, and climate protection.
The impacts of a 1.5°C warmer world would disproportionately affect populations that are already disadvantaged and vulnerable – people who are directly dependent and subsistent on nature, indigenous peoples, children and the elderly, poor workers, slum dwellers, and residents of the Arctic and poor small island states. For them, climate change means food insecurity, higher food prices, a loss of income and alternatives, adverse health effects and the displacement of entire populations.
Without taking the 2030 Agenda and the SDGs into account, it will not be possible to meet the 1.5°C target. At temperatures above +1.5°C, food security, poverty reduction and the reduction of inequalities are hardly possible.
The IPCC also points out that technical solutions to reabsorb carbon dioxide from the atmosphere are currently still in their infancy and involve many technical and – due to the high space requirements – social risks.
The Paris Agreement combines the climate goals with the poverty reduction and sustainable development goals and calls for the fair sharing of action on climate change between generations and between and within nations. All these aspects give the 1.5°C target clear priority over the 2°C target.
Conclusion 1: Common but differentiated responsibilities
GLOBAL OVERVIEW OF PER CAPITA EMISSIONS AND RISKS
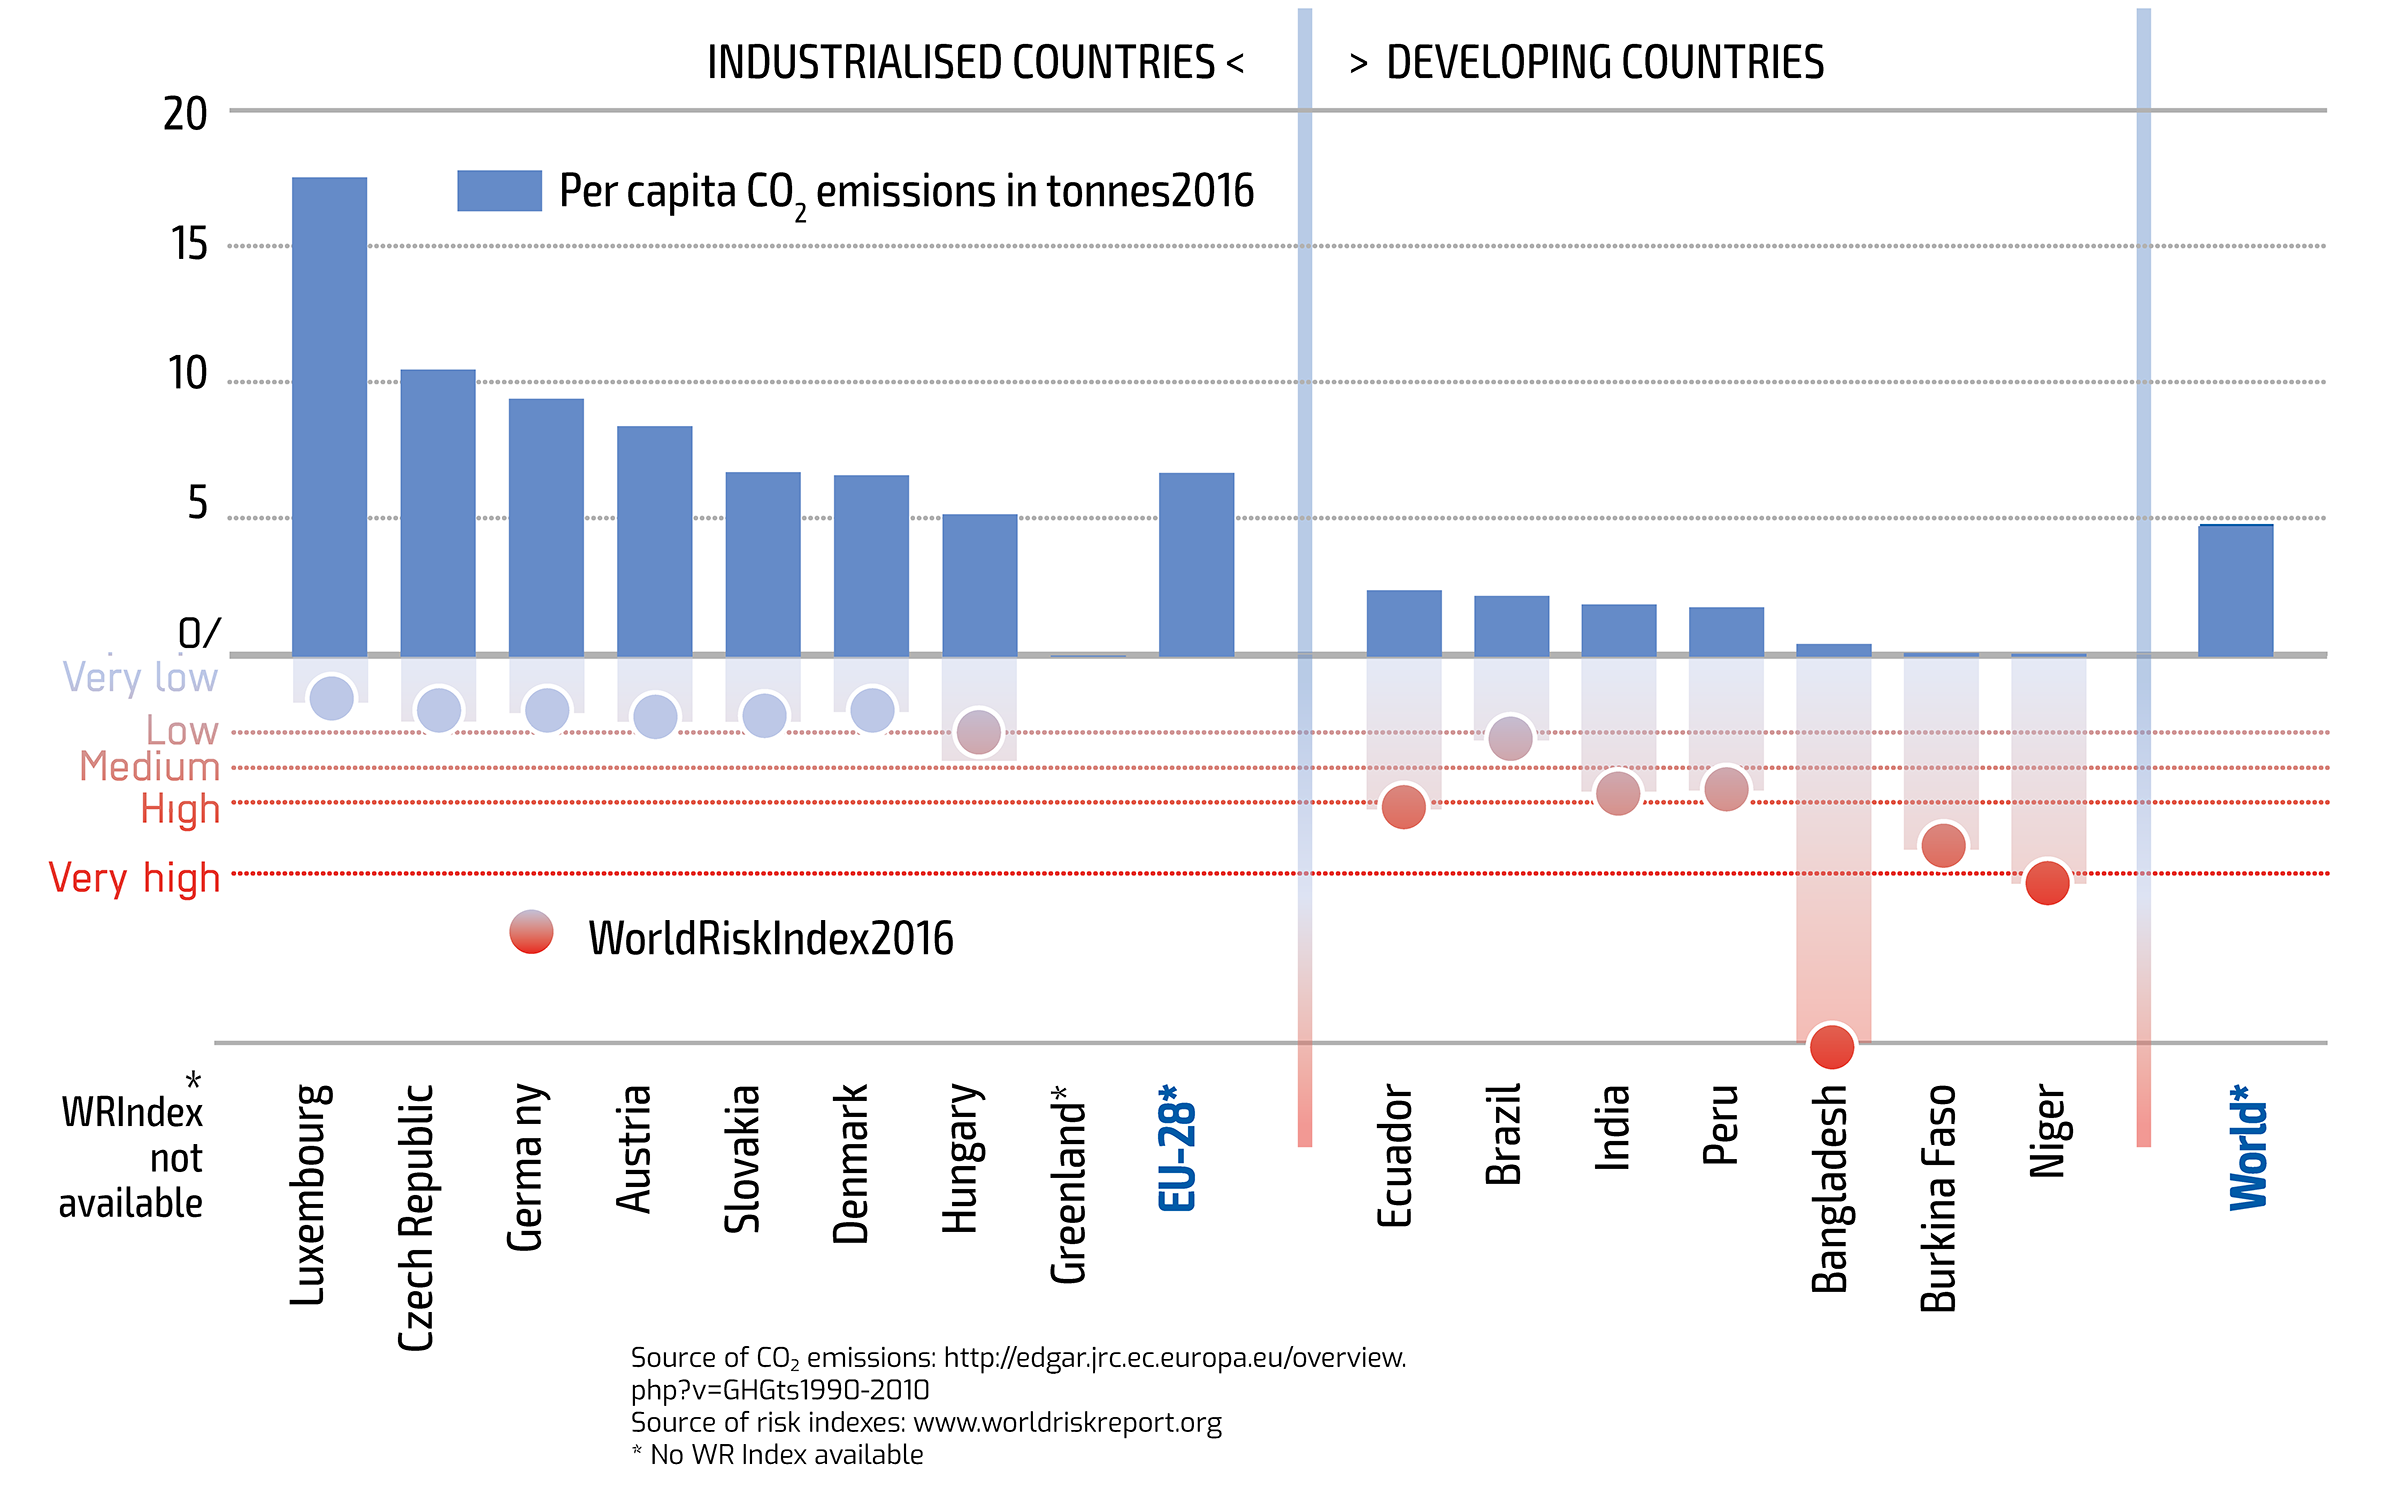
The countries that bear the greatest responsibility for climate change are industrialised countries and the countries that are most vulnerable are developing ones. This unequal situation is the starting point for the fundamental principle in the United Nations Framework Convention on Climate Change agreed in 1992.
One of the few achievements of the 2009 climate summit in Copenhagen was a commitment by the industrialised (‘Annex I’) countries to support developing (‘Non-Annex I’) countries with 100 billion US dollars per year by 2020 for mitigation and adaptation actions (“Long- term financing”).
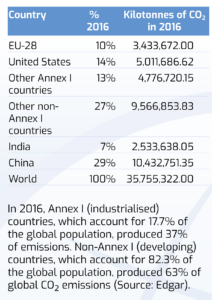
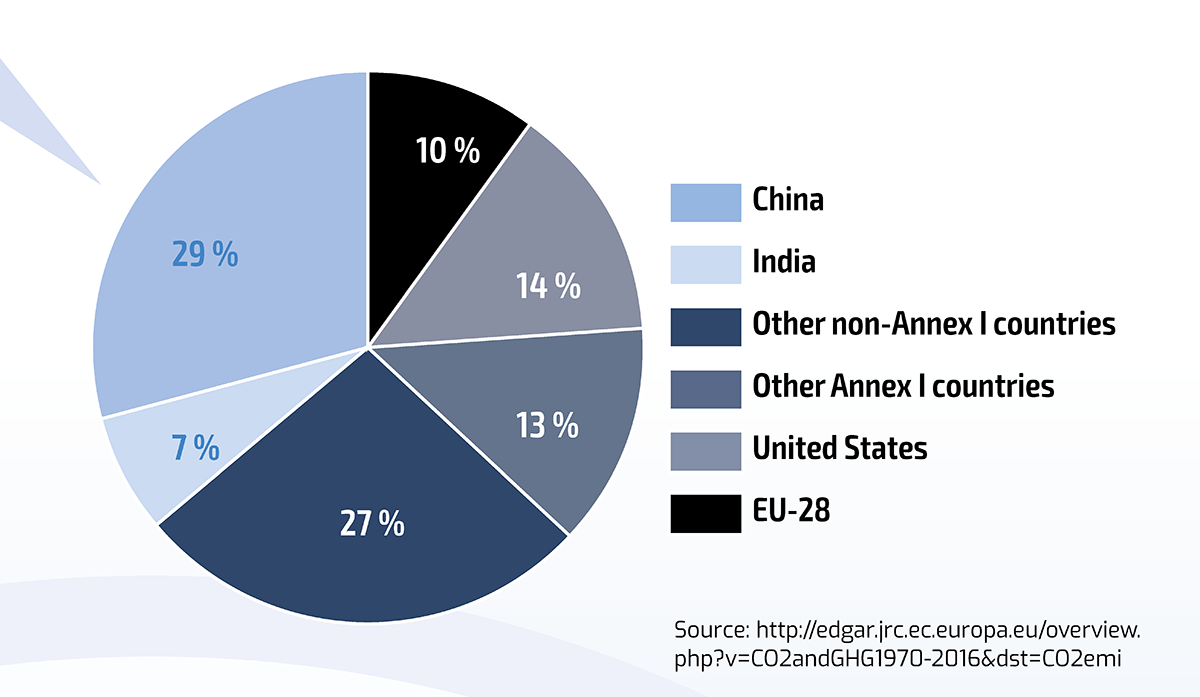
DISTRIBUTION OF GLOBAL CO2 EMISSIONS IN 2016
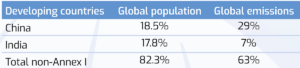
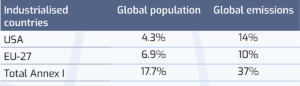
POPULATION AND CO2 EMISSIONS IN 2011 (%):
Conclusion 2: Who emitted the carbon dioxide that is currently in the atmosphere causing climate change?
SHARE OF GLOBAL CO2 EMISSIONS FROM 1840 TO 2006 (%):
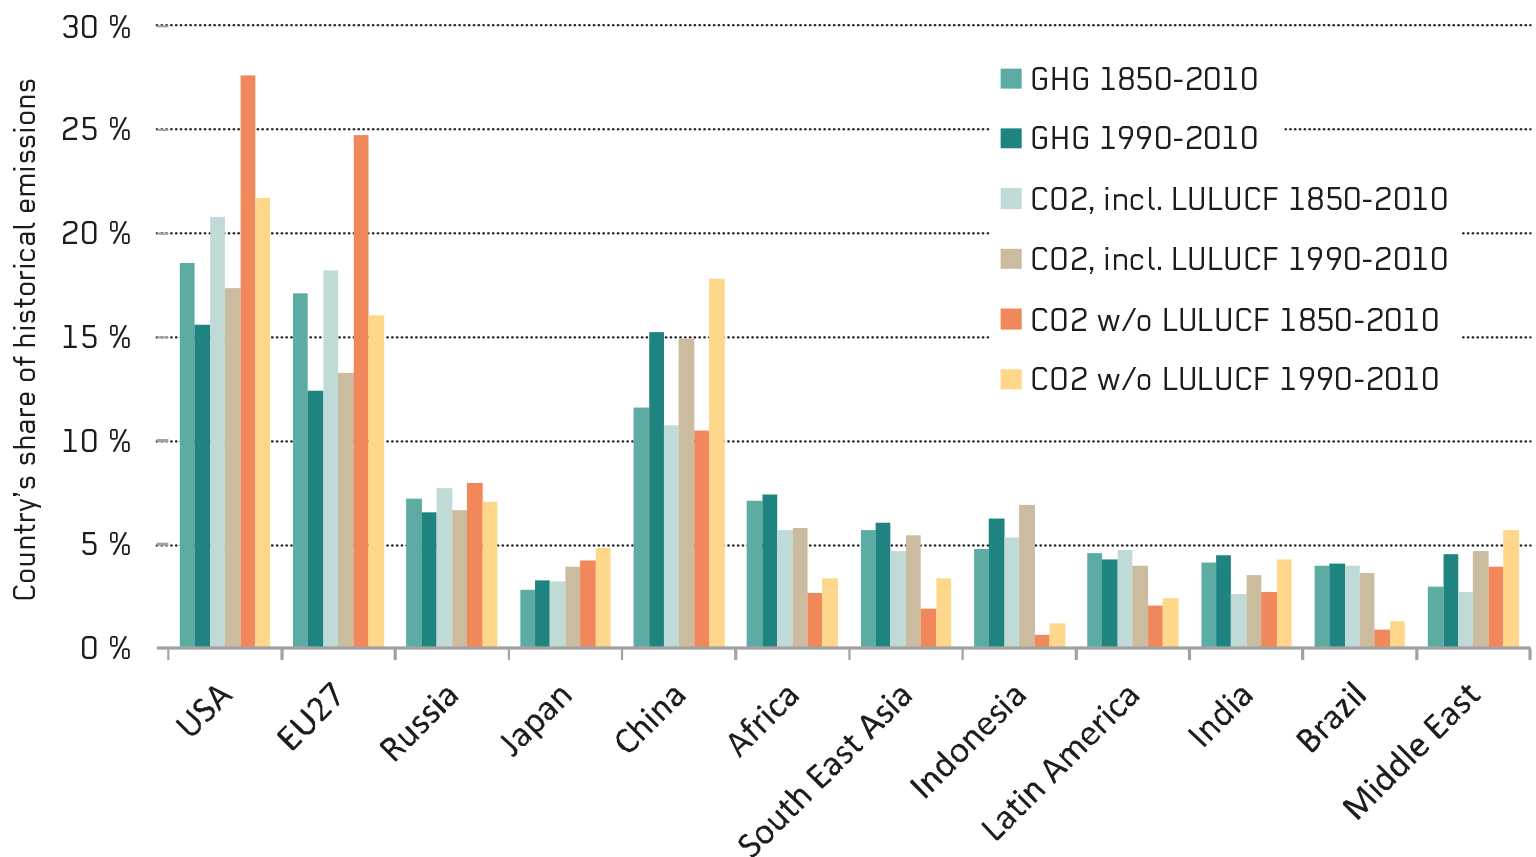
Countries’ cumulative contribution to past emissions, depending on which emission types and time periods are considered. When emissions from the years 1850 to 1990 are excluded, the emissions contributed by most developed countries is reduced somewhat and those of China, and the Middle East in particular, are increased. If the emissions from land use change and forestry (LULUCF) are excluded, the emission contributions of Africa, Indonesia and Brazil as well as other countries in South East Asia and Latin America are significantly lower.
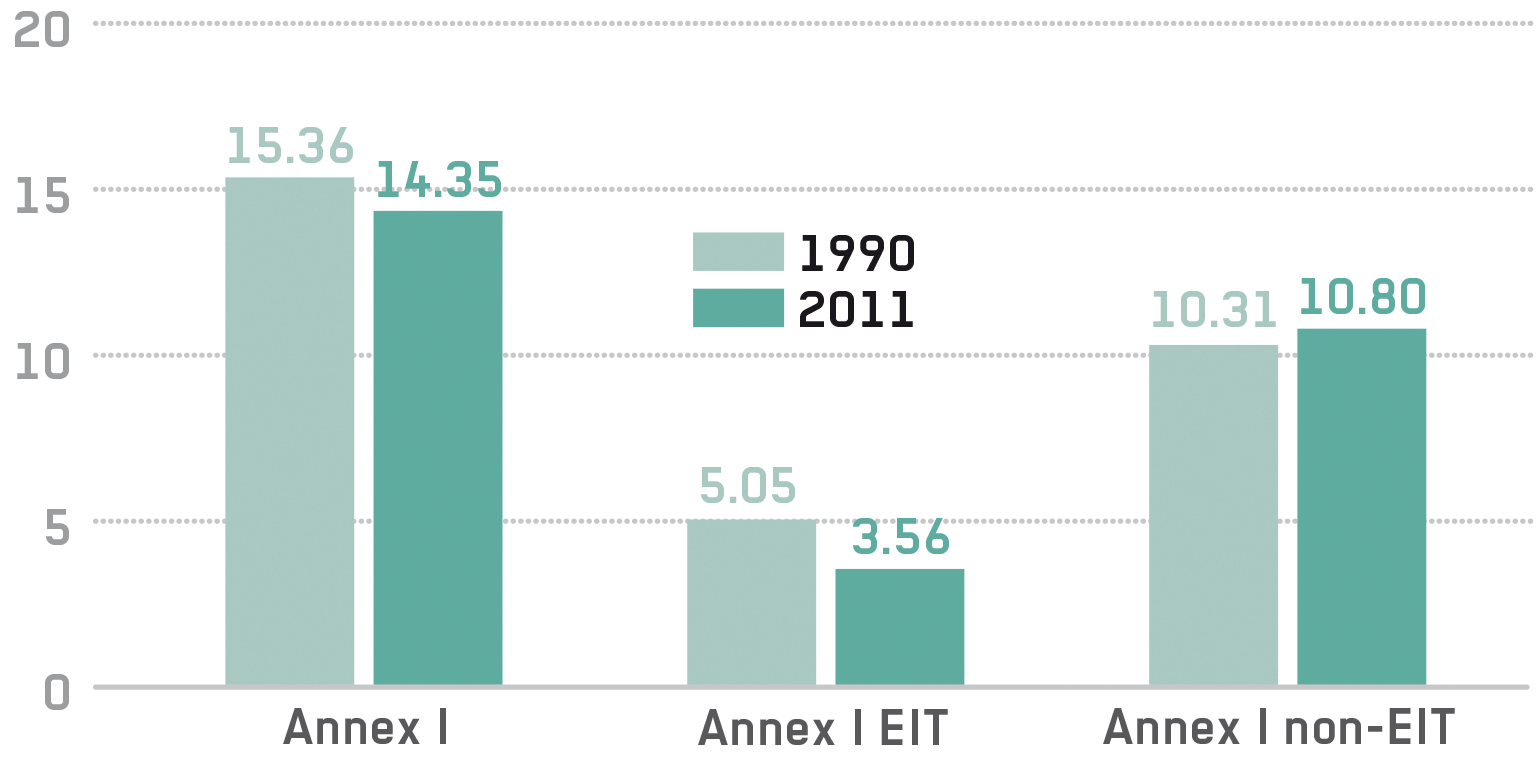
RICH COUNTRIES HIDING BEHIND COLLAPSED ECONOMIES
- Annex I total emissions in 2011 are 6.5% below 1990 levels.
- Annex I EIT (Economies in Transition: former USSR and eastern European countries) emissions in 2011 are 29.5% below 1990 levels because of the collapse of the former USSR and eastern European countries.
- Annex I non-EIT (developed Western countries) emissions in 2011 are actually 4.8% above 1990 levels. Rich developed countries are hiding behind the collapsed economy of the former USSR and eastern European countries in claiming they are meeting their Kyoto targets.
(CSEIndia).
CO2 emission in billion tonnes
Development in the greenhouse? The South’s dilemma
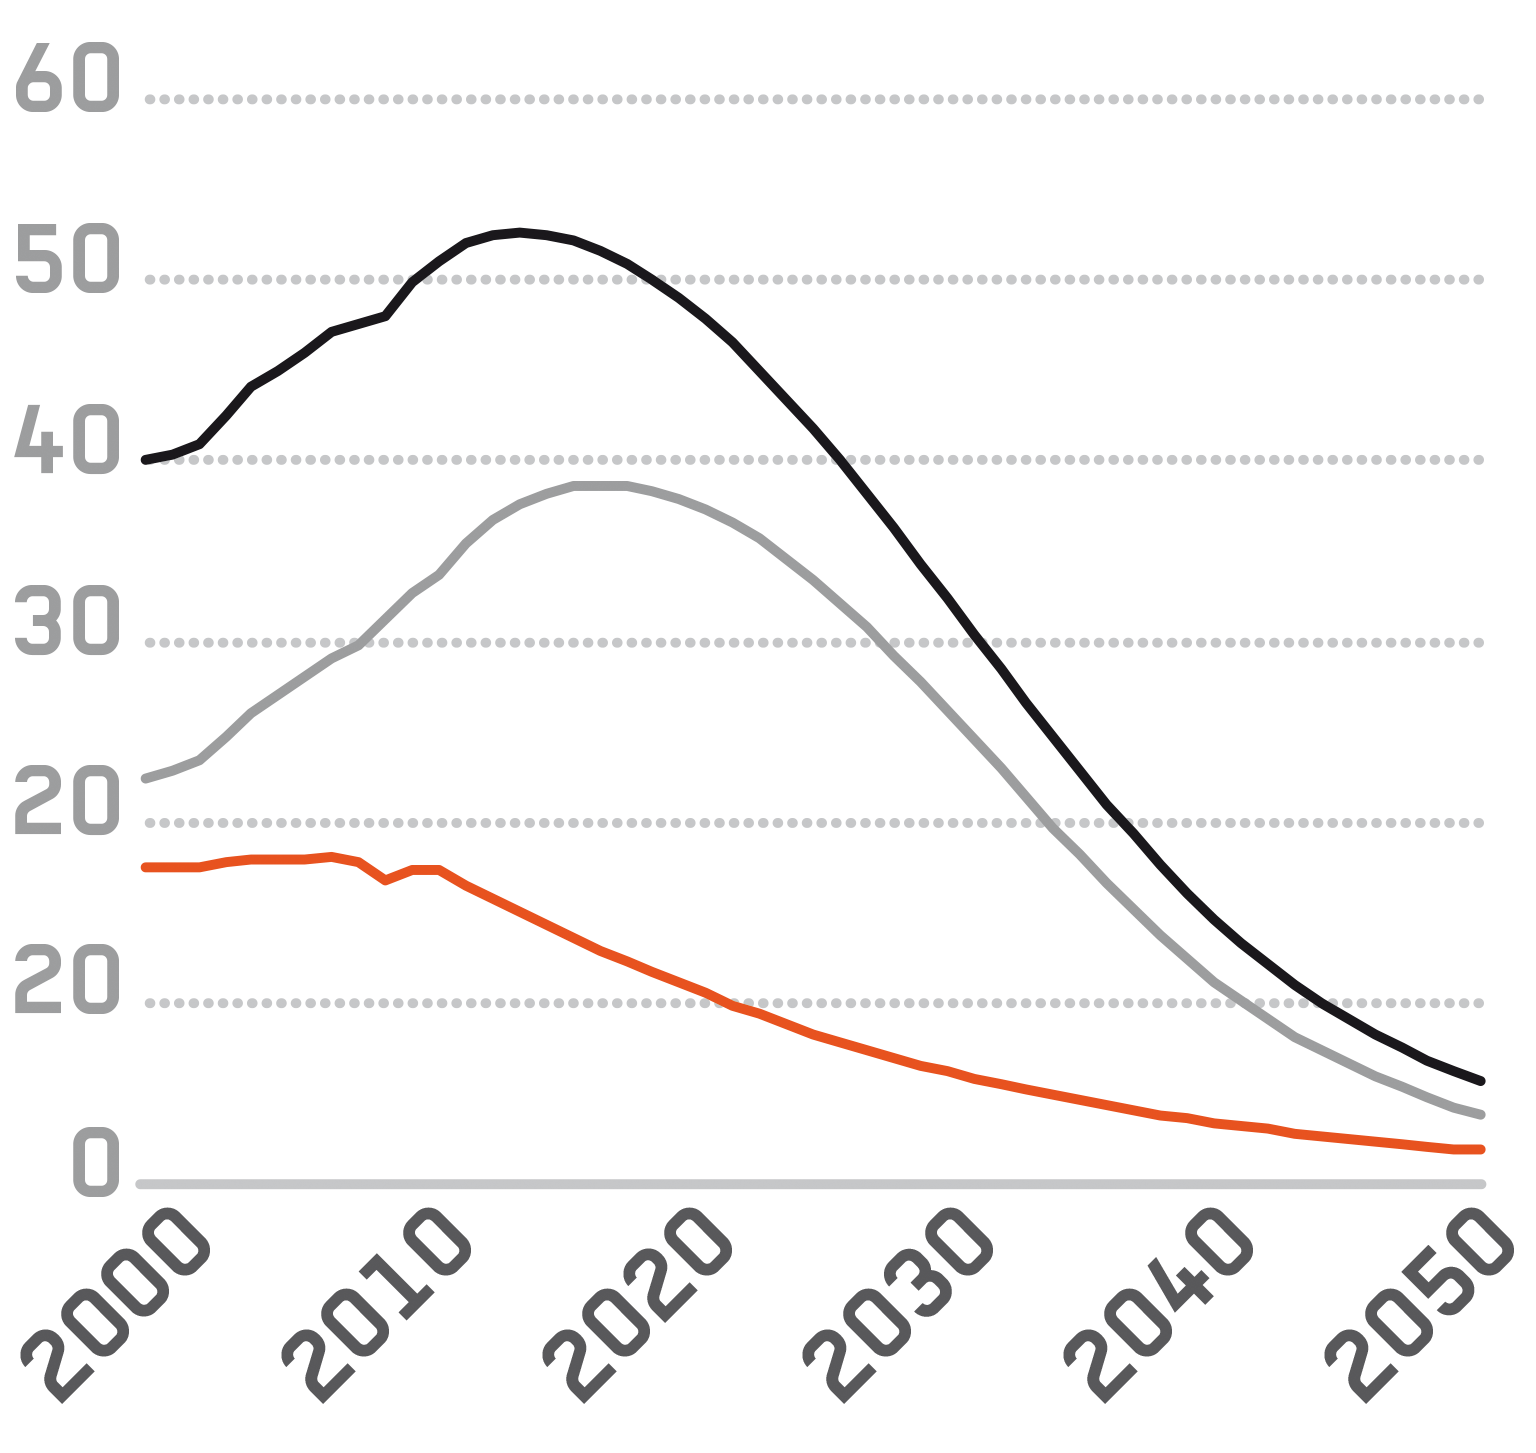
Annual global emissions
The black line shows the necessary path to avoid global warming above +2°C (most developing countries want to avoid +1.5°C). Global greenhouse emissions reach their peak in 2015, then drop to about 90% below their current levels by 2050. The red line shows the emissions in Annex I countries declining to a level 90% below that of 1990 in 2050. The grey line shows, through subtraction, the emissions space left in the atmosphere for developing countries. The later industrialised countries reduce their emissions, the less space in the atmosphere remains for developing countries. (Source: gdrights.org).
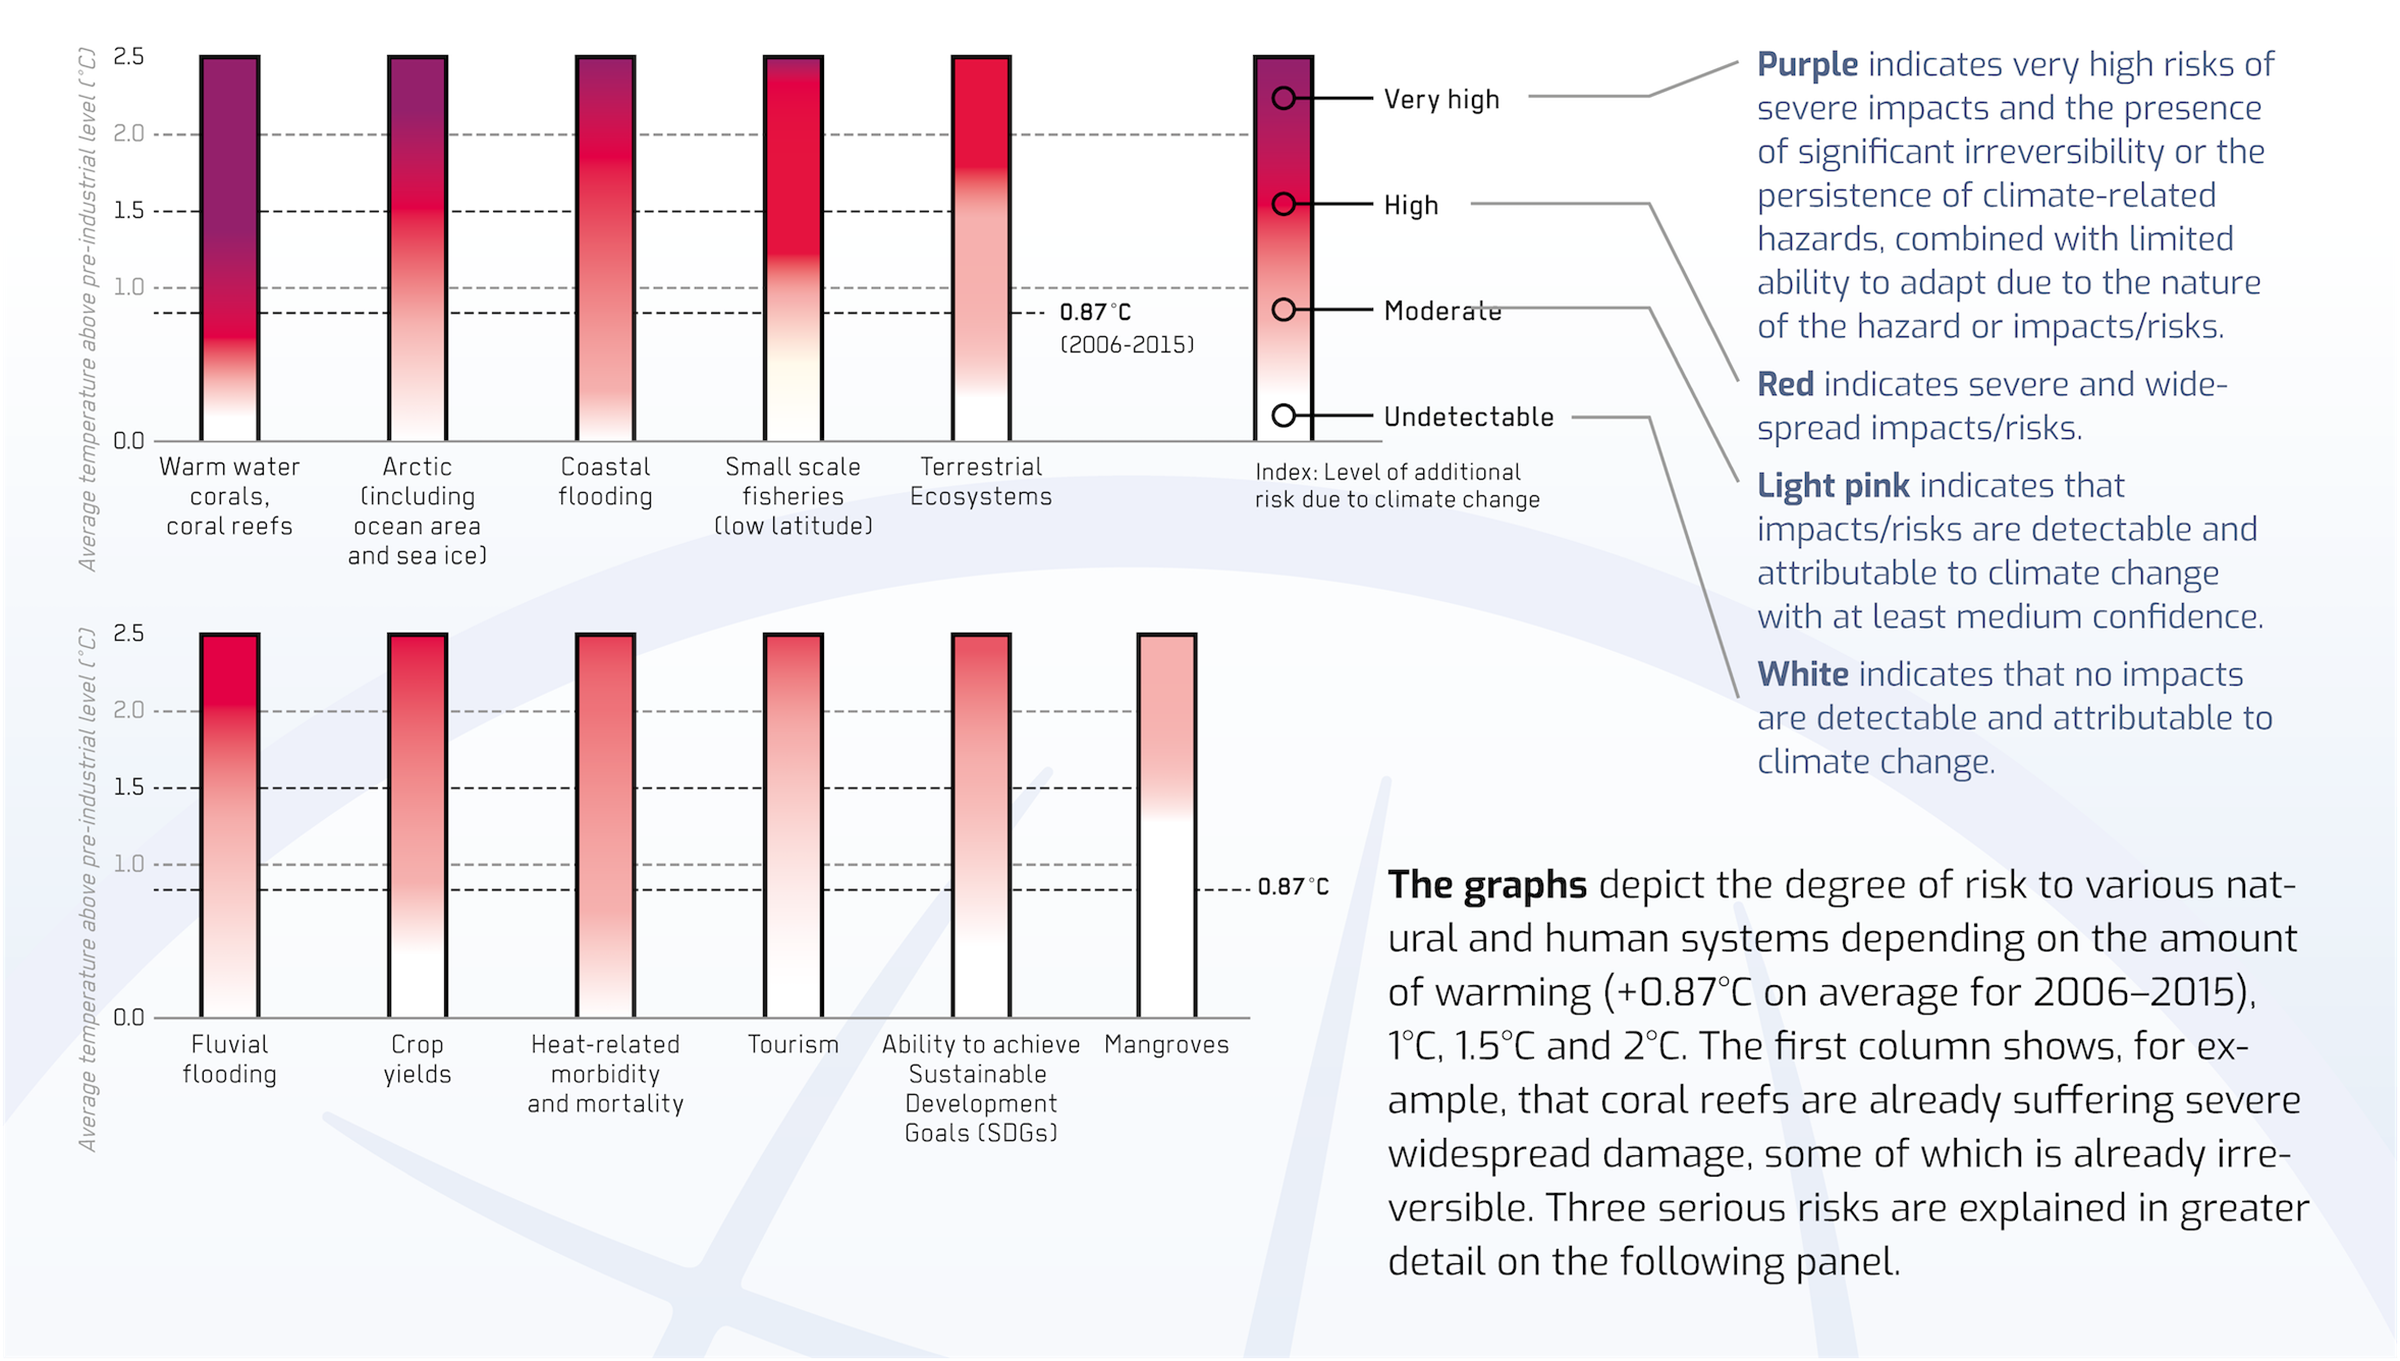
OUR ROLE AND RESPONSIBILITY IN EUROPE
One practical tool to quantify the Climate Convention’s principle of “common, but differentiated responsibility and respective capabilities” is the “Greenhouse Development Rights Framework” (GDR), which was developed by EcoEquity and the Stockholm Environment Institute. It indicates each country’s share in resolving the global climate problem while respecting the rights of poor people, living below a ‘development threshold’, to achieve better living conditions:
A country’s aggregate ‘capability toact’ is defined as the sum of all individual incomes, excluding all income below the ‘development threshold’. Responsibility is similarly defined ascumulative emissions since 1990 excluding emissions that correspond to consumption below the development threshold. These measures of capability and responsibility are then combined (weighted 50/50) into a single indicator of obligation to achieve a ‘Responsibility and Capability Index’ (RCI).
The table below shows the percentage shares for selected (groups of) countries based on CO2 emissions including land-use change emissions for 2010 (with a development threshold of 7,500 US dollars PPP/yr). Accordingly, the European Union should shoulder one quarter (24.9%) of the combined global efforts to tackle climate change, to be achieved not only by reducing its own emissions but also by supporting developing countries’ efforts to reduce their emissions.